This is not the front page

Flourish

Flour·ish

ˈflə-rish

Noun

Flourish is a tool to help you turn your data into interactive charts, maps, and stories. Flourish can help you engage your audience and embed, share, and present data into websites, presentations, social media posts, etc.
Using Interactive Pie Charts to Examine Multi-Level Data Sets

Image
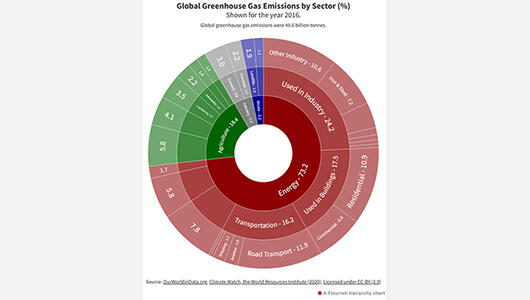
Screenshot of an interactive pie chart showing global greenhouse gas emissions
Photo Credit

Credit: © Penn State is licensed under CC BY-NC-SA 4.0 

EME 801: Energy Markets, Policy, and Regulation deals with a number of complex datasets that are traditionally displayed in a tabular format. To help students visualize the data contained in the tables, Flourish was used to create interactive multi-level pie charts. Students can interact with the pie chart by clicking on the chart to see the distributions within subcategories.