This is not the front page

R Shiny

R Shin·y

/ˈär/ /ˈShīnē/

Noun

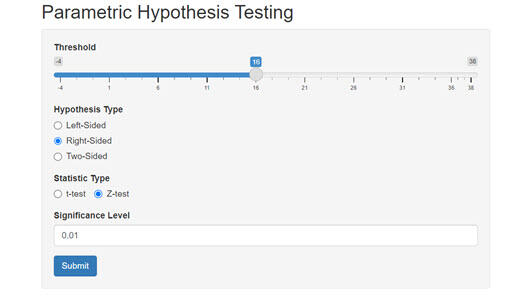
A tool used for the presentation of data in a variety of interactive visual formats. For more information, visit RStudio's website.

Using R Shiny to Visualize Statistical Functions

Image
Screenshot of a Parametric Hypothesis Testing tool
Photo Credit

Credit: © Penn State is licensed under CC BY-NC-SA 4.0 

The R Shiny Parametric Hypothesis Testing tool, shown above, is used in METEO 815 to help the students understand the complicated statistical mathematics behind hypothesis formation and testing. The lesson materials provide the mathematical equations used for hypothesis testing and include a few static images to help illustrate the process.