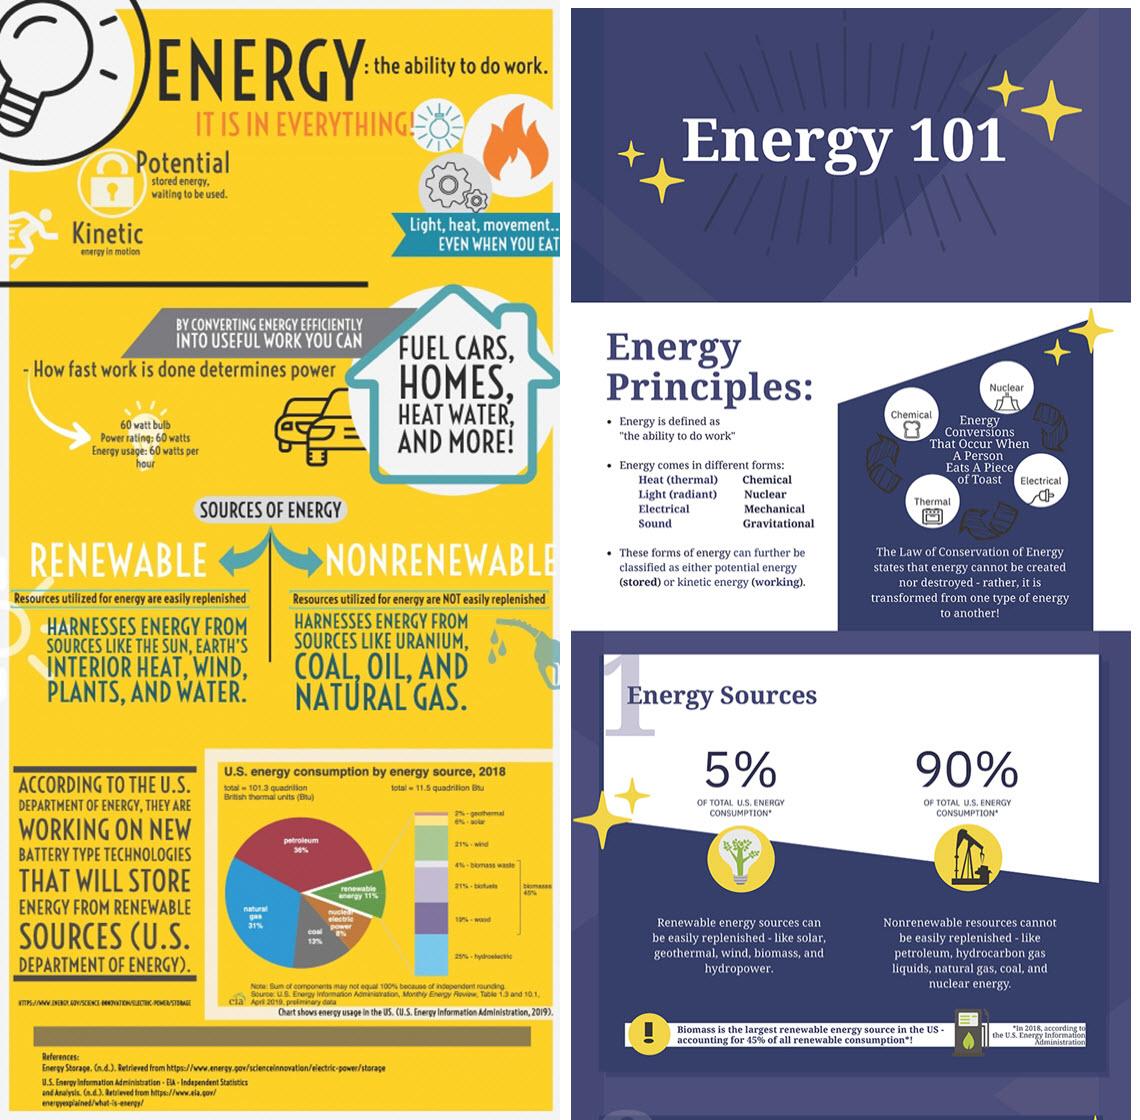
Credit: Leah Baker and Aliana Katz, used with permission
EGEE 401: Energy in a Changing World incorporates infographics as part of the assessment strategy to help students evaluate, analyze, and synthesize assigned readings. Traditionally, the course relied on weekly quizzes, which included both auto-graded and essay questions. While the automated questions alleviated some of the grading workload for the faculty, they didn’t provide an optimal representation of student comprehension. The essays provided the instructor with a stronger valuation of student learning but were time-consuming to grade.
The assessment strategy was redesigned in order to enhance students learning and retention of the material while providing a better balance to the instructor’s grading workload. Infographics encourage the students to review the course material and thoroughly evaluate the concepts presented. Students must then identify one external source, such as a journal article, and synthesize the information in the article with the course content. Students then use a graphic design program such as Adobe Express or Canva to create an infographic to be submitted for grading.
A rubric is used to communicate expectations for student success and consistency of grading across the submissions. Since infographics are a creative activity, grading could easily become subjective. The use of a rubric provides a predetermined set of criteria by which the instructor will evaluate students’ performance on the assignment: accuracy of information, clarity of communications, thoughtful reflection of the content, authenticity of content (prevents students from simply copying and pasting content from the course pages), visual design of the infographic, and proper citations of external sources.
Considerations
Accessibility
- To fully engage in this type of activity, learners need to be able to use a graphic design program in order to both generate graphics/content and review designs that have been created.
- It would be beneficial to provide an alternate form of this assignment to learners with a visual impairment. Ideas might include the creation of a video advertisement or a radio spot audio recording or a text-based description of how various concepts relate to one another.
- To allow individuals with visual impairment to participate in peer review work, consider asking all students to include a text-based description to accompany their infographics. (Text-based versions should also include proper formatting to ensure a screen reader can read the information.)
Other
- Plagiarism: To encourage individual work, require students to review at least one external source (journal article or news publication) and to compare, contrast, or synthesize the information from the two sources into the creation of a meaningful and informative infographic.
- Consistency in grading: Given the artistic and creative aspects of creating infographics, the inclusion of a grading rubric is recommended to ensure there are consistent metrics used to evaluate all submissions. See the example description for more.